Aralco Report Engine is feature-rich and easy to use with real-time and extensive capabilities for producing accurate and superior reports with in-depth analysis so that you can make timely and correct decisions. There are over 100 standard reports that can be further modified to user specifications.
With its user-definable tool to create your own custom or modify reports, extracting any data for reporting is no longer an onerous task for your back-office employees. Aralco Reporting Engine is the perfect data analytics tool for retailers and it will save you countless man-hours preparing reports for analytics every day and periodically.

BUILD YOUR OWN REPORT
You can design a new report on your own easily without the need for costly customization by programmers. Simply use the following tab options to create one quickly or whenever you need to make changes to any existing reports:
FILTERING TAB |
Where you define the date range, include and exclude location, brand, department, season, customer type, supplier, etc. |
GROUPING TAB |
Where you specify the grouping for summarizing data by groups such as location, customer, department, supplier, brands season, or any category. |
COLUMN TAB |
Where you can define to insert any fields/values in the columns of the report such as:
- Product Code/Name
- Cost of Sales
- GP% or Margins,
- Quantity Sold & At Hand
- Sell Through Rate
- Stock Valuation
- Commission Calculations
- Average Spending and more. |
REPORT FORMATS AND USAGES
Real-time reporting is another key feature in Aralco Retail Systems, and it comes with the following comprehensive report formats for you to choose from to meet all your reporting requirements:
REPORT FORMATS | REPORT USAGE | SUPPORTS |
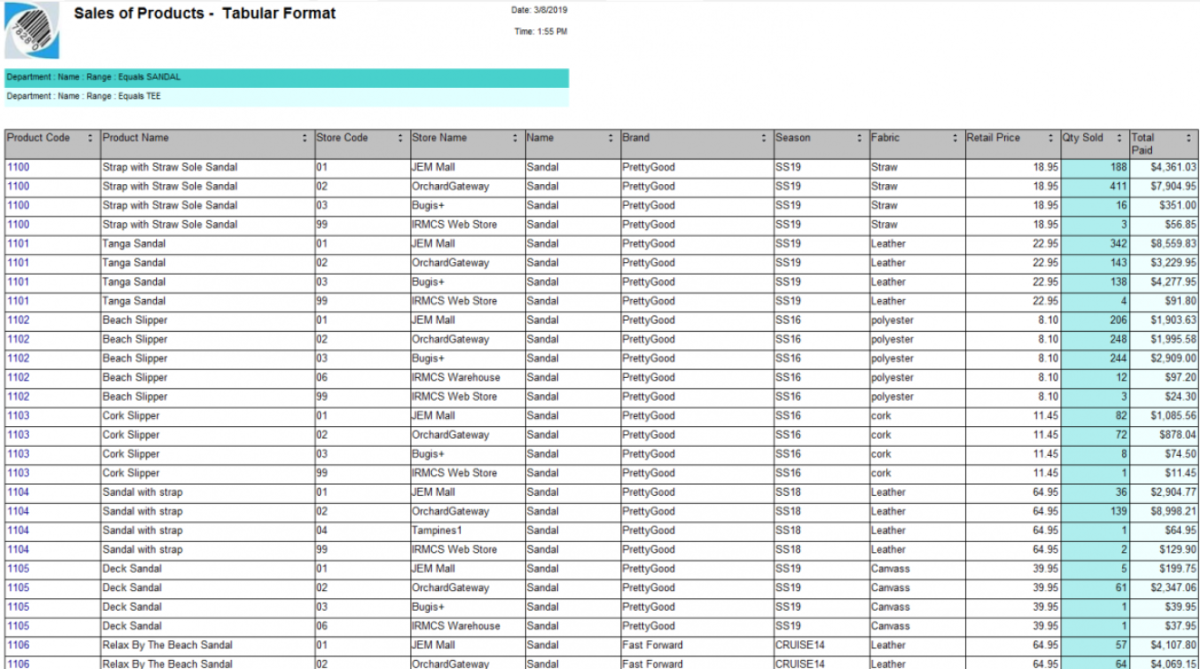
TABULAR |
Basic reporting listing rows of data in relation to each column. |
Formulas; Images of products; Email Scheduler |
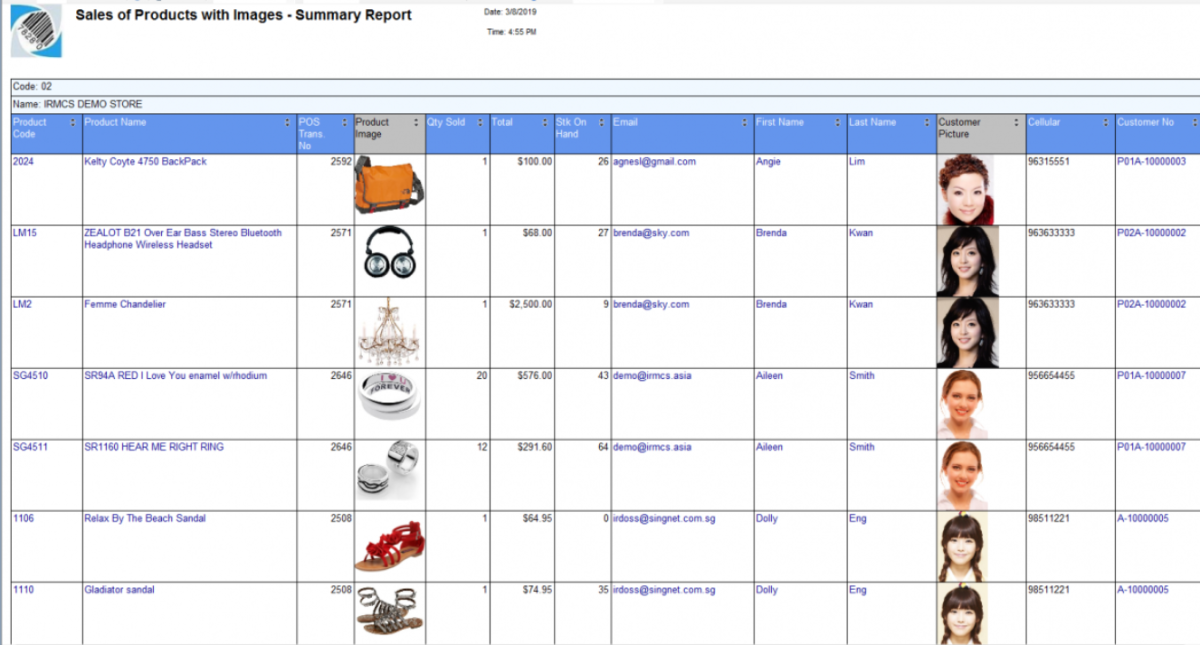
SUMMARY |
Group & summarizes rows of data in relation to each column. |
Formulas; Images of products; Email Scheduler |
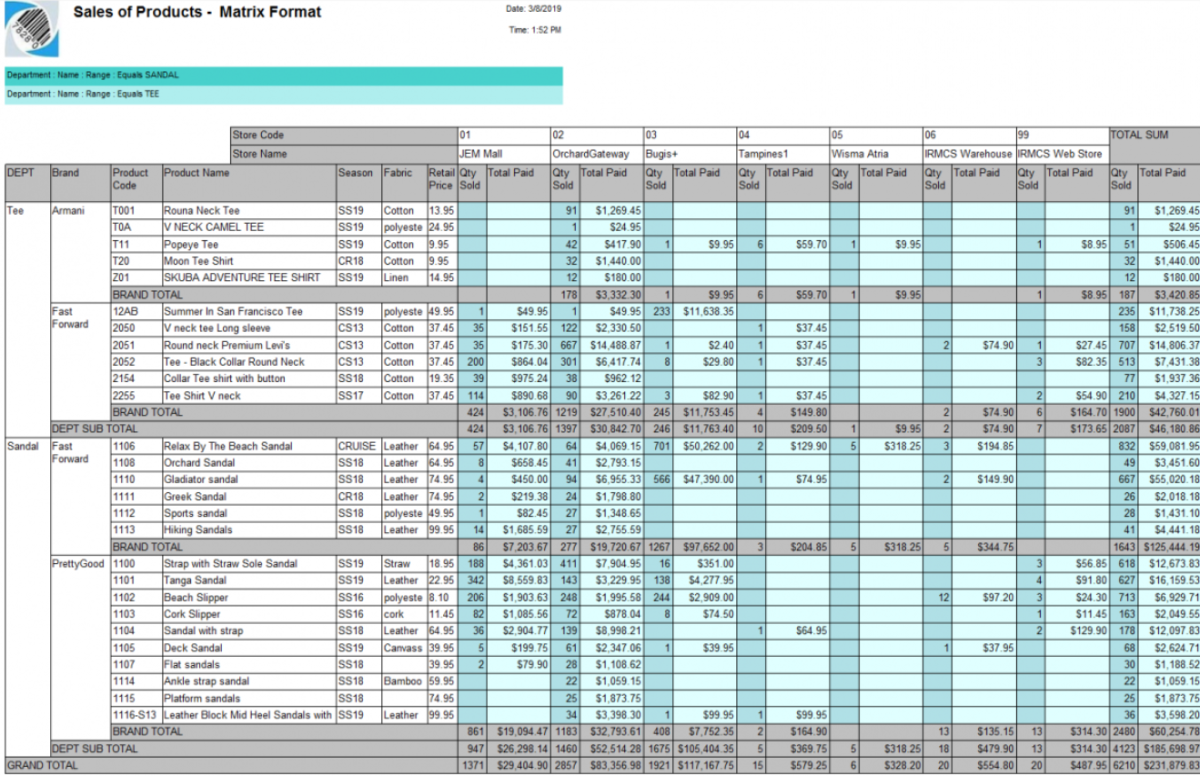
MATRIX |
Group & summarizes data by columns and rows. |
Formulas; Images of products; Email Scheduler |
CUBE |
Drag & drop data to columns & rows for multidimensional view. |
Formulas |
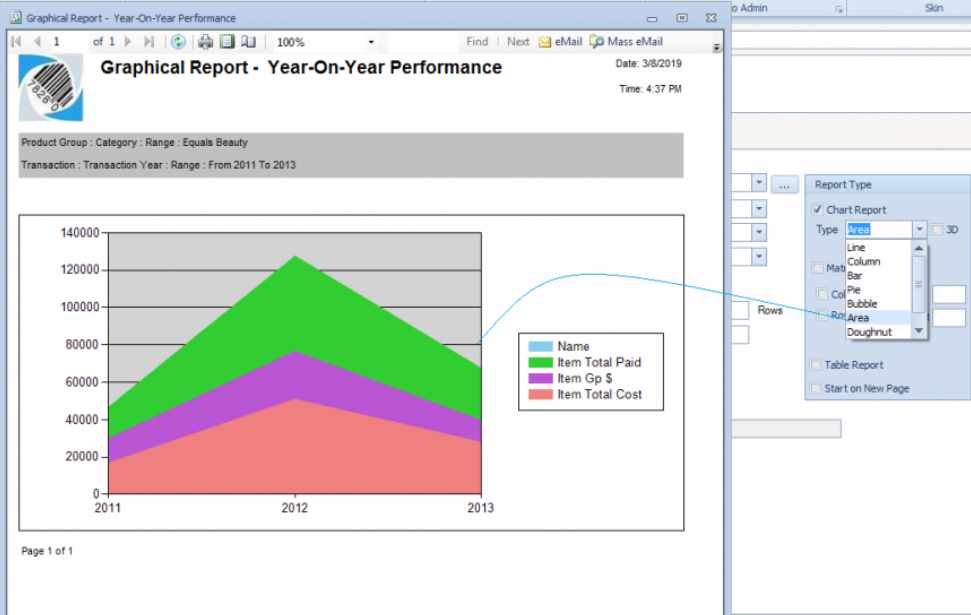
CHART |
Chart type: Area, Bar, Bubble, Column, Doughnut, Line, & Pie |
Email Scheduler |
TABULAR REPORT | SUMMARY REPORT |
 |  |
MATRIX REPORT | CHART REPORT |
 |  |
REPORTING INTERFACE TO
MS OUTLOOK, WORD, EXCEL, WORD & PDF
All Aralco reports are prepared as HTML (or ASCII) files and readily convertible with a click of a button to Microsoft (MS) Excel, MS Word or PDF format. In the MS documents, you can make a modification such as for your own presentation or applications of formulas and other calculations.

.NET Reporting Engine |
Read about more Reporting Feature - Cube Analytics